Funnel Comparison
Summary
Funnel Comparison is a Marketing Analytics feature that helps you understand how funnel performance changes over time by comparing different periods and visitor segments. It enables you to visualize funnel changes, compare conversion rates, identify trends, and analyze the impact of optimizations across up to six visitor segments.
Overview
Funnel Comparison helps you evaluate how funnel performance changes over time by comparing different date ranges and visitor segments. It provides visibility into conversion trends, step-by-step funnel changes, and audience behavior, helping you understand the impact of website optimizations and identify opportunities for improvement
How can Funnel Comparison help you?
It can be frustrating to spend hours and hours trying to understand the changes in your funnel after you and your team complete the last round of content optimizations. Funnel Comparison is a new Siteimprove feature that makes it easy to see what has changed in the funnel and understand the impact on different visitor segments.
Providing you with an overview of the different steps in the funnel and giving you the option to compare the results to a different period, this tool can help determine your conversion rate and what positive trends you can share.
With Funnel Comparison, you can visualize changes, see the difference in the funnel chart, and view the specific changes between the steps by hovering over the funnel. You can also analyze up to six visitor segments, providing insights into performance during the specified comparison period. This feature enables you to track improvements in paid traffic or to identify decreases in visitors from specific devices or countries.
How to Find and Use the Feature
You can enable the feature if you have 'Marketing Analytics'.
To find the Funnel Comparison feature:
- Open the Siteimprove platform.
- In the main menu to the left, click Marketing Analytics > Behavior > Funnels.
- Click on a funnel and the “comparison” tab will be available as displayed below.
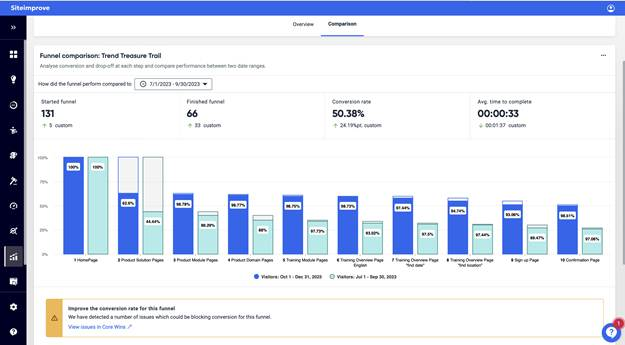
Comparing Funnel Performance
Use the page filters at the top to select the funnel period and/or a segment filter. 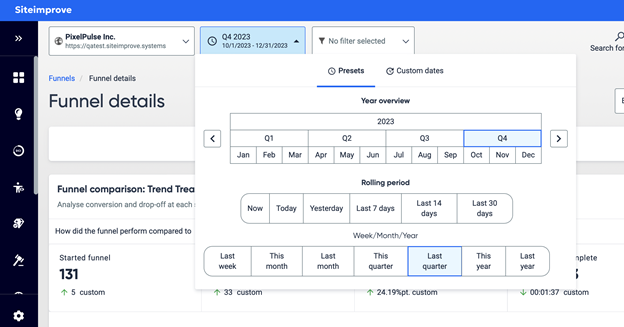
Use the “how did the funnel perform” filter to determine the time period you want to compare the funnel against: 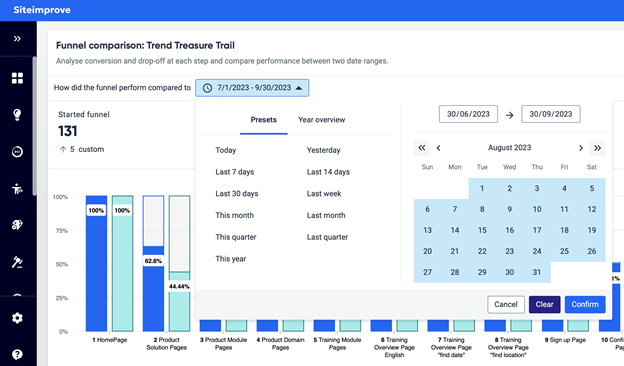
Performance Breakdown
Use the “Performance Breakdown” option to see the performance of up to six segment filters. The breakdown will automatically use the same period as selected before and will show how these segments have changed between the time periods.
You can create segment filters optimized for your business. You can read more about it here: In what ways can I filter my Analytics data? 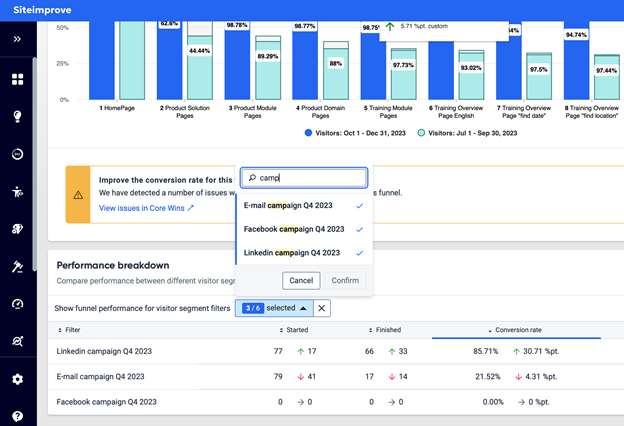
Did you find it helpful? Yes No
Send feedback