Sites Progress
Summary
Sites Progress helps you measure and compare performance trends across your sites or groups of sites using DCI, Accessibility, Quality Assurance, and SEO scores. You can compare up to 200 sites, analyze tagged groups of sites, evaluate performance over time, compare against industry benchmarks, and review trends through dedicated reporting widgets.
Overview
Sites Progress helps you see the progress your site(s) or group of sites are making across our DCI scores. You can find it under DCI > Sites Progress.
Define What to Compare
Compare Sites
To compare individual sites with each other, select “Sites” in the Site selector. You can choose up to 200 sites at a time. From here, you can select the Sites you are interested in and get a graph showing a line for each site selected. 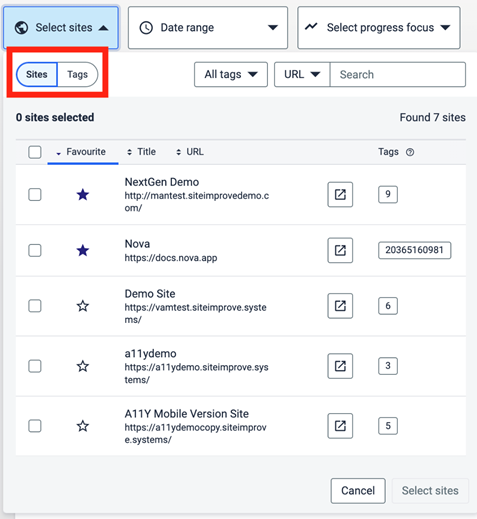
Compare Groups of Sites (Tags)
To get a higher-level view of your account, you can use tags to categorize your sites into groups. For example, you can group sites run by a specific department or ones that cover a given topic to get a collective overview of those sites.
Select Tags in the Site picker to see different tags created in your account. For each tag, the average of the scores for the sites within that tag will display as a single line in your graph. 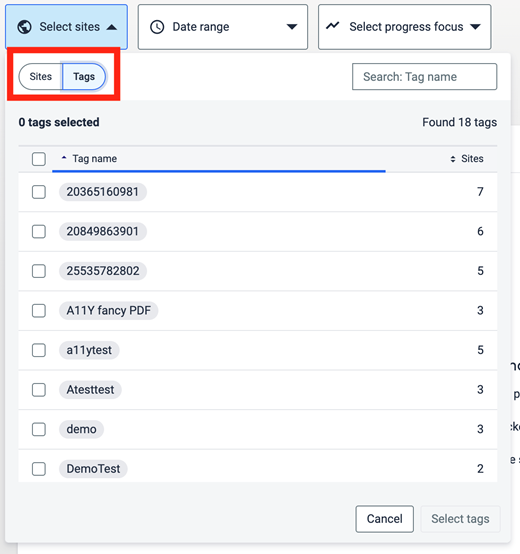
Define Your Time Range
Before results are displayed, you'll need to specify the timeframe you're interested in. 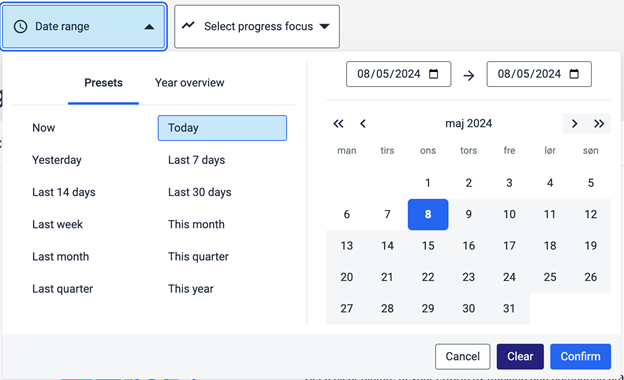
Define Your Metric
Lastly, you need to define the metrics you want to look at. The options are:
- DCI score
- Accessibility score
- Quality Assurance score
- SEO score
You can also compare your sites against the Average score of the options you selected, the Industry Benchmark score, or a combination of both of these scores. 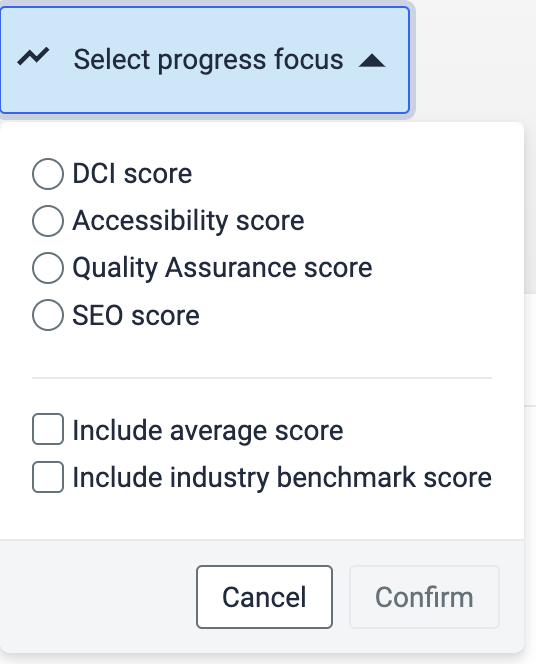
Analyze Your Data
You'll get 3 widgets after having configured your data.
Overview Widget
This widget will give you a brief overview of how all of the selected are performing in your specified timeframe and tell you what your best and worst performing site or tag is. 
Sites Progress Over Time
This widget will display the data points you configured earlier. You can export the data to a CSV file for easy access and to view annotations. 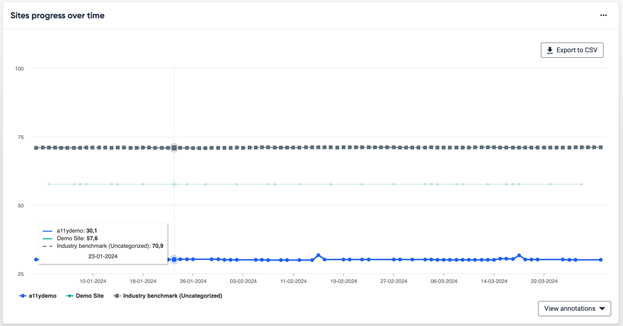
Sites Progress Trends
In the sites progress trends widget you can get an overview of each site with a trend line showing its change in the specified time period. This widget also gives easy access to dive into the product and to visit the existing progress pages to see what issues are available on it. 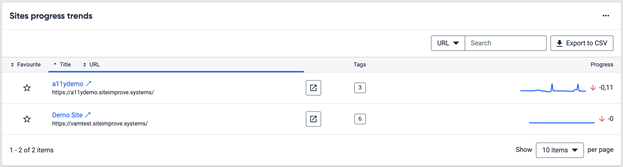
Did you find it helpful? Yes No
Send feedback